NAME
Term::Fabulous::Chart::Curve - How lines connect the points of a series
SYNOPSIS
use Term::Fabulous::Chart::Curve qw(curve_points y_at);

my @points   = ( [ 0, 10 ], [ 10, 30 ], [ 20, 15 ] );
my $polyline = curve_points( \@points, 'monotone', step => 0.5 );
my $height   = y_at( $polyline, 12.5 );
DESCRIPTION
The curve of a line or area series decides how the line runs from one data point to the next. Every curve passes through all data points.
linear(the default)-
Straight lines.
step,step-after-
The value holds until the next point, where the line jumps: right for counters and states that change at the moment of a sample.
stepis short forstep-after. step-before-
The line jumps at the start of each interval to the next value.
step-middle-
The line jumps halfway between two points.
monotone-
A smooth curve that never overshoots: between two points it stays between their values, and it is flat at local highs and lows (the Fritsch-Carlson method). The best smooth curve for data.
catmull-rom-
A smooth curve through all points (a cardinal spline). The series option
tension(0 to 1, default 0) tightens it; 1 gives straight lines. It may overshoot a little. natural-
The smoothest curve through the points (a natural cubic spline); it may overshoot noticeably.
- an easing name, or a code reference
-
Each segment follows an easing function from Term::Fabulous::Chart::Easing (
ease-in-out-sine,ease-out-bounce, ...), or your own function fromt(0 to 1) to the share of the change.
A chart takes the curve as the curve option of a series or of the whole chart (see "Curves" in Term::Fabulous::Widget::XYChart):
curve  => 'monotone',
series => [ { name => 'load', data => \@load, curve => 'step' } ],
series => [ { name => 'eased', data => \@data, curve => sub ($t) { $t**2 } } ],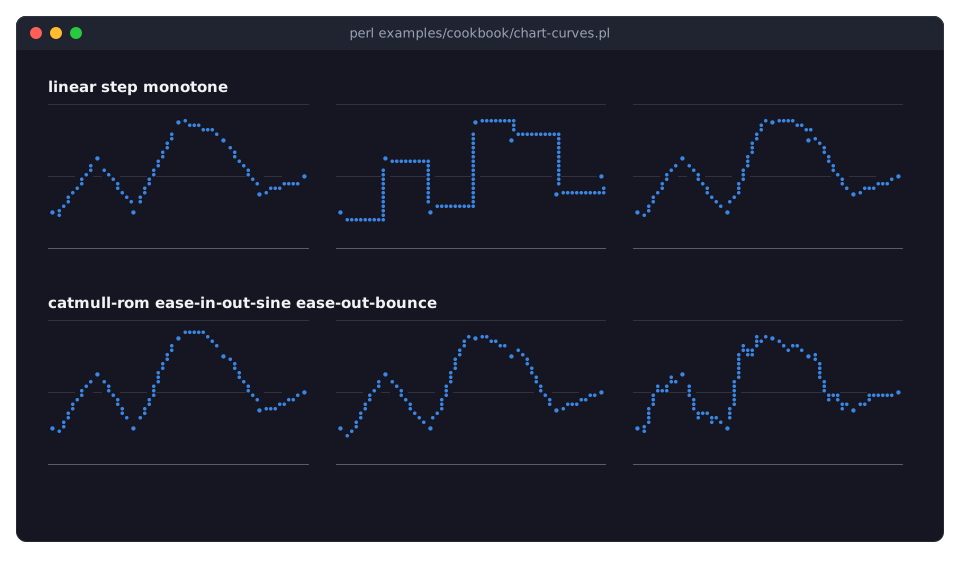
The program is in "Connect points with curves and easings (curve)" in Term::Fabulous::Cookbook::ChartStyles.
FUNCTIONS
curve_points
my $polyline = curve_points( \@points, $curve, step => $step, tension => $tension );The vertices of a polyline drawing the curve through the points (array references [x, y], x ascending, in any units), as an array reference of [x, y]. Straight lines return the points, steps the corners of the steps. Smooth curves and easings get a vertex every $step along x (default 1, a positive number) besides the points; the chart passes the width of one subpixel. tension (0 to 1, default 0) is used by catmull-rom. Several points may share an x (repeated samples): the polyline runs straight up or down through them, for every curve. Dies for an unknown curve.
between => [ $first, $last ] (two point indexes, $first not after $last) returns only the part of the polyline from point $first to point $last: the vertices the whole polyline has there, as the slopes of smooth curves are worked out from all points. A chart passes the points around its plot, so a long series outside the plot costs no vertices. Dies for indexes outside the points.
y_at
my $y = y_at( $polyline, $x );The height of a polyline at $x, interpolated between the vertices around it; undef outside the polyline. Where the polyline runs straight up or down (a step), the y where that run ends.
curve_names
All curve names: the shapes, sorted, then the easing names, sorted.
is_curve, check_curve
check_curve( $owner, $name, $curve );is_curve returns 1 for a curve name or a code reference, else 0. check_curve returns the curve, or dies with $owner and $name at the start of the message.
SEE ALSO
Term::Fabulous::Chart::Easing, Term::Fabulous::Widget::XYChart.