NAME
Area - A class for writing Excel Area charts.
SYNOPSIS
To create a simple Excel file with an Area chart using Excel::Writer::XLSX:
#!/usr/bin/perl

use strict;
use warnings;
use Excel::Writer::XLSX;

my $workbook  = Excel::Writer::XLSX->new( 'chart.xlsx' );
my $worksheet = $workbook->add_worksheet();

my $chart     = $workbook->add_chart( type => 'area' );

# Configure the chart.
$chart->add_series(
    categories => '=Sheet1!$A$2:$A$7',
    values     => '=Sheet1!$B$2:$B$7',
);

# Add the worksheet data the chart refers to.
my $data = [
    [ 'Category', 2, 3, 4, 5, 6, 7 ],
    [ 'Value',    1, 4, 5, 2, 1, 5 ],
];

$worksheet->write( 'A1', $data );

__END__
DESCRIPTION
This module implements Area charts for Excel::Writer::XLSX. The chart object is created via the Workbook add_chart() method:
my $chart = $workbook->add_chart( type => 'area' );Once the object is created it can be configured via the following methods that are common to all chart classes:
$chart->add_series();
$chart->set_x_axis();
$chart->set_y_axis();
$chart->set_title();
These methods are explained in detail in Excel::Writer::XLSX::Chart. Class specific methods or settings, if any, are explained below.
Area Chart Subtypes
The Area chart module also supports the following sub-types:
stacked
percent_stacked
These can be specified at creation time via the add_chart() Worksheet method:
my $chart = $workbook->add_chart( type => 'area', subtype => 'stacked' );EXAMPLE
Here is a complete example that demonstrates most of the available features when creating a chart.
#!/usr/bin/perl
use strict;
use warnings;
use Excel::Writer::XLSX;
my $workbook = Excel::Writer::XLSX->new( 'chart_area.xlsx' );
my $worksheet = $workbook->add_worksheet();
my $bold = $workbook->add_format( bold => 1 );
# Add the worksheet data that the charts will refer to.
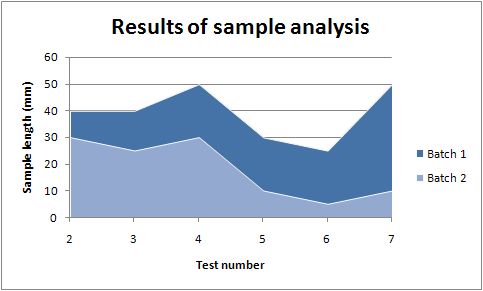
my $headings = [ 'Number', 'Batch 1', 'Batch 2' ];
my $data = [
[ 2, 3, 4, 5, 6, 7 ],
[ 40, 40, 50, 30, 25, 50 ],
[ 30, 25, 30, 10, 5, 10 ],
];
$worksheet->write( 'A1', $headings, $bold );
$worksheet->write( 'A2', $data );
# Create a new chart object. In this case an embedded chart.
my $chart = $workbook->add_chart( type => 'area', embedded => 1 );
# Configure the first series.
$chart->add_series(
name => '=Sheet1!$B$1',
categories => '=Sheet1!$A$2:$A$7',
values => '=Sheet1!$B$2:$B$7',
);
# Configure second series. Note alternative use of array ref to define
# ranges: [ $sheetname, $row_start, $row_end, $col_start, $col_end ].
$chart->add_series(
name => '=Sheet1!$C$1',
categories => [ 'Sheet1', 1, 6, 0, 0 ],
values => [ 'Sheet1', 1, 6, 2, 2 ],
);
# Add a chart title and some axis labels.
$chart->set_title ( name => 'Results of sample analysis' );
$chart->set_x_axis( name => 'Test number' );
$chart->set_y_axis( name => 'Sample length (mm)' );
# Set an Excel chart style. Blue colors with white outline and shadow.
$chart->set_style( 11 );
# Insert the chart into the worksheet (with an offset).
$worksheet->insert_chart( 'D2', $chart, 25, 10 );
__END__This will produce a chart that looks like this:
AUTHOR
John McNamara jmcnamara@cpan.org
COPYRIGHT
Copyright MM-MMXX, John McNamara.
All Rights Reserved. This module is free software. It may be used, redistributed and/or modified under the same terms as Perl itself.