NAME
Chart::GGPlot - ggplot2 port in Perl
VERSION
version 0.0000_02
STATUS
At this moment this library is still under active development (at my after-work time) and is highly incomplete. Basically only what's in the examples directory is able to work now. And its API can change without notice.
Besides, it heavily depends on my Alt::Data::Frame::ButMore library, which is also experimental.
DESCRIPTION
This Chart-GGPlot library is an implementation of ggplot in Perl. It's designed to be possible to support multiple plotting backends. And it ships a default backend which uses Chart::Plotly.
This Chart::GGPlot module is the function interface of the Perl Chart-GGPlot library.
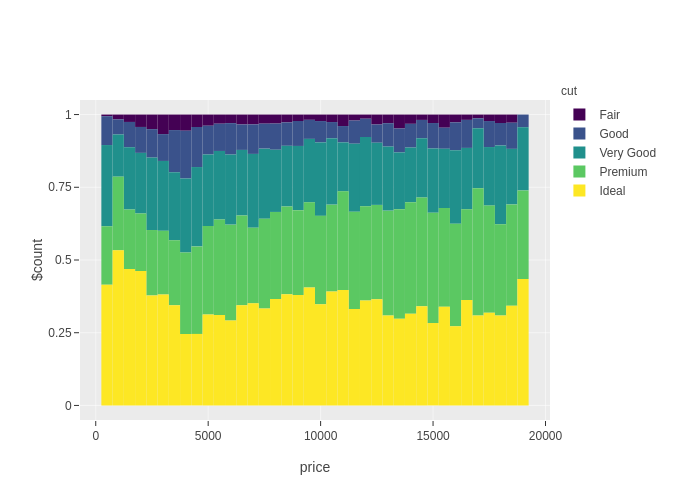
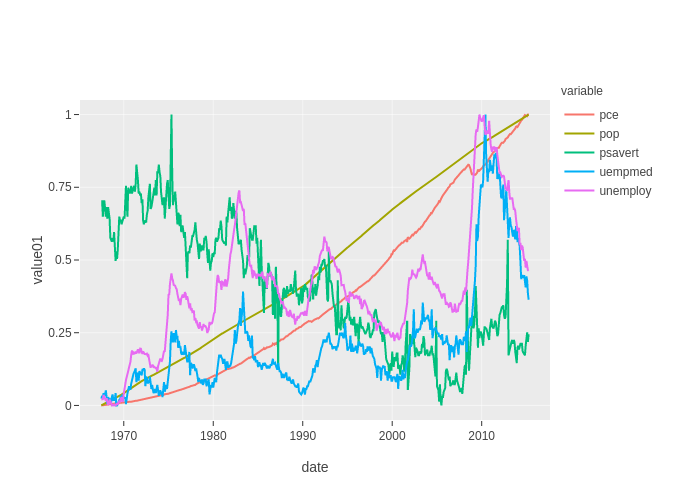
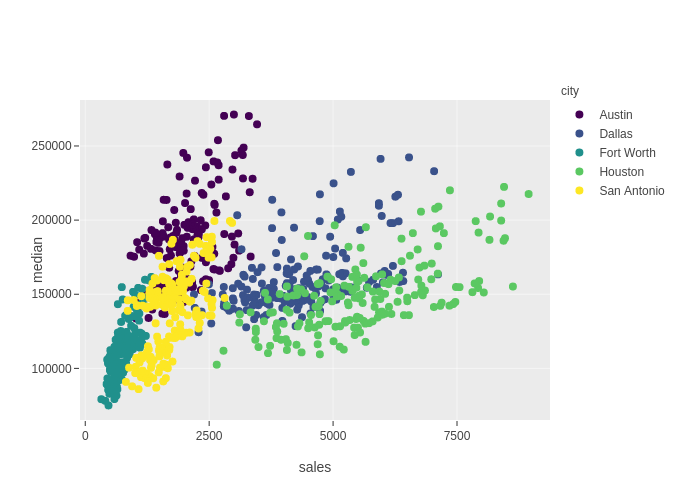
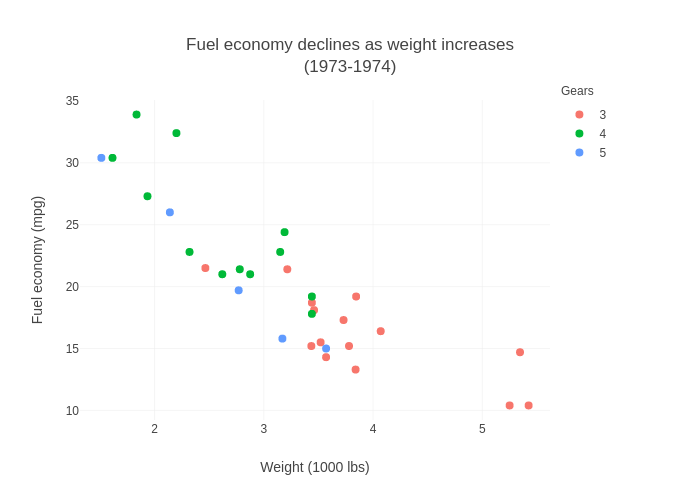
Example exported image files:


FUNCTIONS
ggplot
ggplot(:$data, :$mapping, %rest)This is same as Chart::GGPlot::Plot->new(...). See Chart::GGPlot::Plot for details.
qplot
qplot(:$x, :$y,
      Str :$geom='auto',
      :$xlim=undef, :$ylim=undef,
      :$title=undef, :$xlab='x', :$ylab='y',
      %rest)
ENVIRONMENT VARIABLES
CHART_GGPLOT_TRACE
A positive integer would enable debug messages.
SEE ALSO
AUTHOR
Stephan Loyd <sloyd@cpan.org>
COPYRIGHT AND LICENSE
This software is copyright (c) 2019 by Stephan Loyd.
This is free software; you can redistribute it and/or modify it under the same terms as the Perl 5 programming language system itself.