NAME
Term::Fabulous::Widget::AreaChart - Lines with the area below them filled
SYNOPSIS
use Term::Fabulous::Widget::AreaChart;

my $chart = Term::Fabulous::Widget::AreaChart->new(
	title   => 'Traffic by source',
	stacked => 1,
	curve   => 'monotone',
	labels  => [qw(Mon Tue Wed Thu Fri Sat Sun)],
	series  => [
		{ name => 'Search', data => [ 420, 460, 455, 510, 480, 300, 280 ] },
		{ name => 'Social', data => [ 180, 150, 210, 260, 300, 340, 310 ] },
		{ name => 'Direct', data => [ 120, 130, 125, 140, 135, 110, 100 ] },
	],
);

$chart->stacked('percent');    # each day as shares of 100%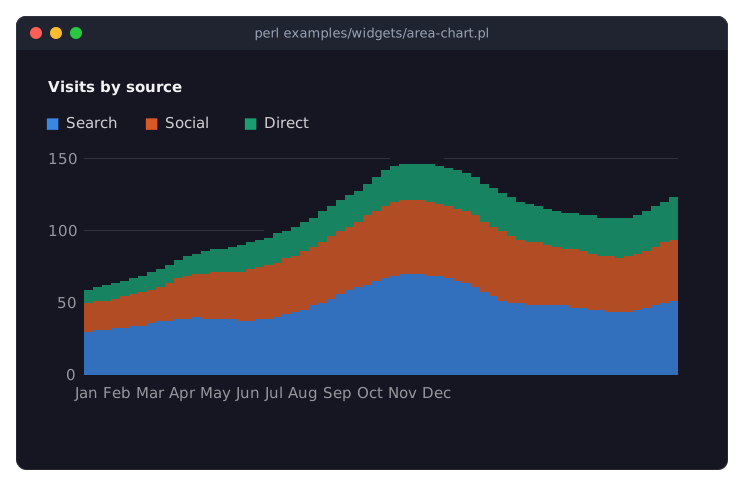
The program is examples/widgets/area-chart.pl.
DESCRIPTION
An area chart is a line chart whose series are filled down to the baseline, in block characters placed to an eighth of a cell, translucent so that overlapping areas show through each other: 0.6 of the color over the background, 0.8 when the areas are stacked. With stacked the areas lie on each other and show how parts add up to a whole; stacked => 'percent' shows the shares. The y axis includes zero, where the areas grow from.
An area has no line along its top by default; line => 1 adds one in Braille dots. fill_opacity sets the translucency, curve the shape of the top. Everything else is described on Term::Fabulous::Widget::XYChart; an AreaChart is an XYChart whose series are area series unless they say otherwise.
CONSTRUCTOR
new
my $chart = Term::Fabulous::Widget::AreaChart->new(%parameters);The parameters of "CONSTRUCTOR" in Term::Fabulous::Widget::XYChart and "CONSTRUCTOR" in Term::Fabulous::Widget::Chart. For areas: stacked, fill_opacity, line, curve, marker (block by default).
METHODS
Those of "METHODS" in Term::Fabulous::Widget::XYChart.
KDL PROPERTIES
use Term::Fabulous::Widget::AreaChart as AreaChart

AreaChart "traffic" {
	stacked #true
	curve "monotone"
	labels "Mon" "Tue" "Wed"
	series "Search" { data 420 460 455 }
	series "Social" { data 180 150 210 }
}
See "KDL PROPERTIES" in Term::Fabulous::Widget::XYChart.
SEE ALSO
Term::Fabulous::Widget::XYChart, Term::Fabulous::Widget::LineChart, "CHARTS" in Term::Fabulous::Manual::Charts, "Stacked areas and shares of 100% (AreaChart)" in Term::Fabulous::Cookbook::Charts.