NAME
Term::Fabulous::Chart::Marker - The character sets charts draw with
SYNOPSIS
use Term::Fabulous::Chart::Marker;

my $braille = Term::Fabulous::Chart::Marker->named('braille');
say $braille->columns, 'x', $braille->rows;    # 2x4 subpixels per cell

# The cell for the drawn subpixels of one cell (undef = not drawn):
my ( $glyph, $fg, $bg ) = $braille->cell( [ 0xFF0000, undef, undef, 0xFF0000, ( undef ) x 4 ], 0x141923 );
# ( "\x{2811}", 0xFF0000, undef ): two dots in red, background kept
DESCRIPTION
A chart draws its lines, areas, bars and points into a grid of subpixels, several per terminal cell, and turns each cell's subpixels into one character with a foreground and a background color. A marker is the set of characters used for that, and decides how many subpixels a cell has. The chart widgets take the marker names as the marker of a series (see "Rendering styles" in Term::Fabulous::Widget::XYChart).
braille-
2 x 4 subpixels: the Braille patterns U+2800 to U+28FF, one dot per subpixel. The finest resolution, for lines and points. A cell has only one foreground color, so where series cross, the cell takes the color of the dot drawn last (see "cell"); the background stays as it was.
block-
1 x 8 subpixels: the lower eighth blocks U+2581 to U+2588, for bars and areas that grow from the bottom: a bar's top is placed to an eighth of a cell. The upper half and upper eighth blocks complete it.
block-horizontal-
8 x 1 subpixels: the left eighth blocks U+2589 to U+258F, for horizontal bars. Charts use it for
blockwhen the bars are horizontal. half-
1 x 2 subpixels: the upper and lower half blocks, two colors per cell. The subpixels are about square.
quadrant-
2 x 2 subpixels: the quadrant blocks U+2596 to U+259F.
sextant-
2 x 3 subpixels: the sextant blocks U+1FB00 to U+1FB3B of the "Symbols for Legacy Computing". Smoother than quadrants, but not every font has them; terminals that draw block characters themselves (kitty, WezTerm, foot, Ghostty and others) show them everywhere.
The block markers show two colors per cell: the character's shape in the foreground color over the background color. A cell whose subpixels have more colors shows the two most frequent ones, and every other subpixel takes the nearer of the two. block and block-horizontal cannot show every shape; a shape they lack is shown as the most similar one.
The box style of chart lines is not a marker: the chart draws box lines in cells, without subpixels.
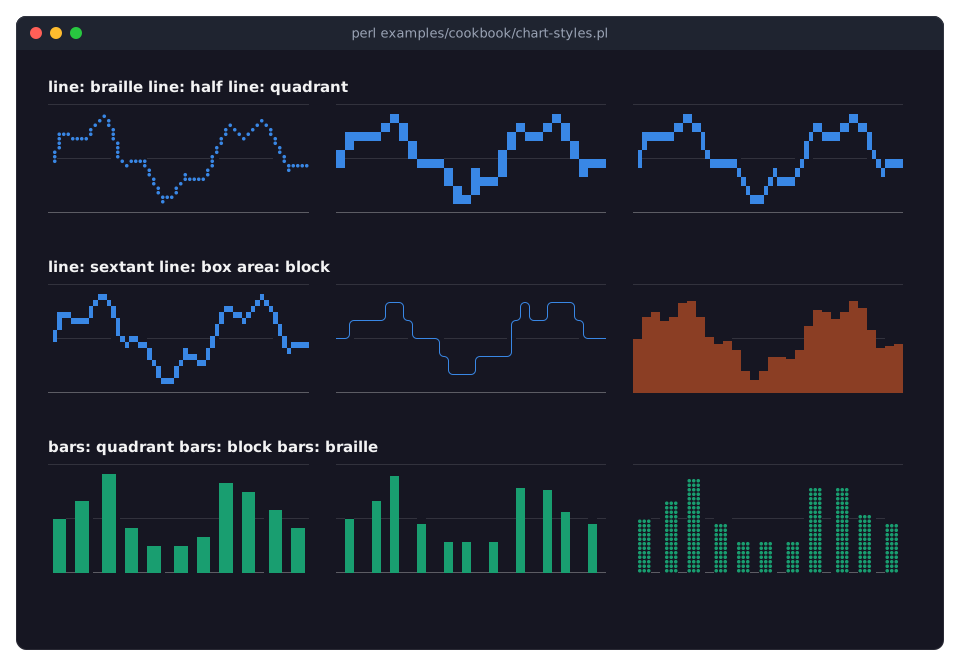
The program is in "Draw with Braille, blocks or box lines (marker)" in Term::Fabulous::Cookbook::ChartStyles.
CLASS METHODS
named
my $marker = Term::Fabulous::Chart::Marker->named($name);The marker of a name (braille, block, block-horizontal, half, quadrant, sextant); the same object every time. Dies for unknown names.
names
The names of all markers, sorted.
is_name
1 for the name of a marker, else 0.
METHODS
name
The marker's name.
columns, rows
The subpixels per cell across and down.
subpixels
columns * rows.
cell
my ( $glyph, $fg, $bg, $dominant ) = $marker->cell( \@colors, $under, \@drawn );The character for one cell. @colors holds a color (a packed 0xRRGGBB integer) or undef for each subpixel, row by row from the top-left corner. $under is the cell's background, which undrawn subpixels show (undef for none). @drawn, optional, tells for each subpixel when it was drawn (larger is later; see "each_cell" in Term::Fabulous::Chart::Raster): a Braille cell then takes the color of the dot drawn last, so a series drawn on top of others keeps its color where they cross; without it, the color most dots have.
Returns the glyph and its colors; an undef background means "keep the cell's background". The block markers return a fourth value, the color most of the cell shows (undef for the cell's background; on a tie, the background below, so a fill never looks larger than it is): a Braille line drawn over the cell later uses it as its background, so a fill keeps its shape to half a cell. Returns the empty list when no subpixel was drawn, so the cell keeps what it shows.
SEE ALSO
Term::Fabulous::Chart::Raster, Term::Fabulous::Widget::Chart.