NAME
Term::Fabulous::Widget::Chart - What all chart widgets have in common: title, legend, colors and hover
SYNOPSIS
# Chart is abstract; you use its subclasses:
use Term::Fabulous::Widget::LineChart;

my $chart = Term::Fabulous::Widget::LineChart->new(
	title       => 'Requests per second',
	legend      => 'bottom',               # auto, top, bottom, left, right, none
	palette     => 'classic',              # or [ '#3987e5', '#d95926', ... ]
	theme       => 'auto',                 # dark or light ink, from the background
	label_color => '#8b93a7',
	series      => [ { name => 'api', data => \@api }, { name => 'web', data => \@web } ],
);

$chart->on( SeriesHover => sub ($event) {
	$status->text( defined $event->series ? $event->series . ': ' . ( $event->value // '' ) : '' );
	return;
} );
$chart->highlight('api');    # emphasize one series from the program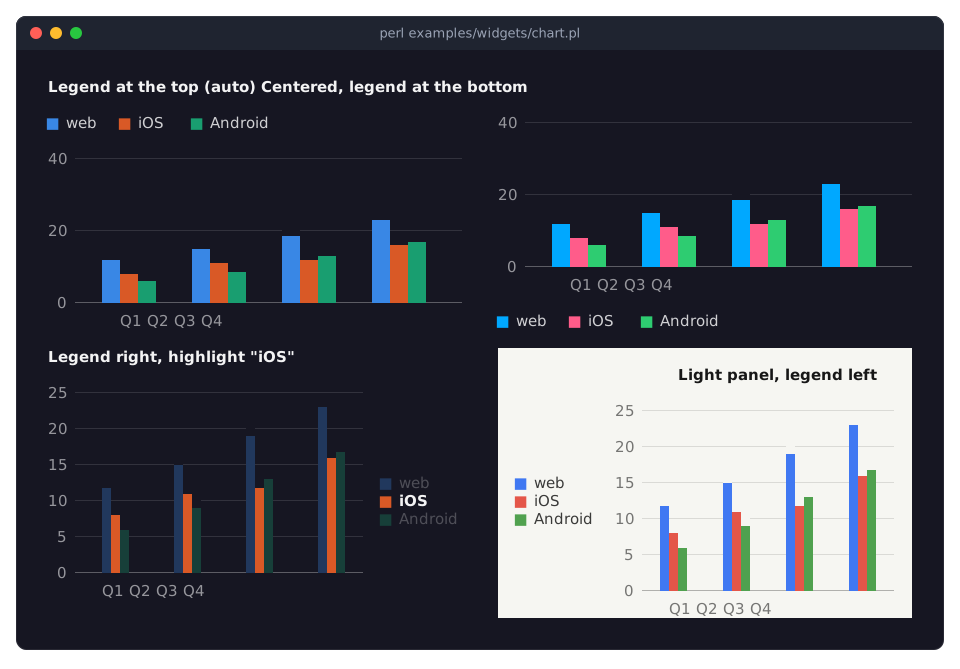
examples/widgets/chart.pl shows the features of this page on four bar charts: title alignment, legend positions, palettes, highlight and the light theme.
DESCRIPTION
The base class of the chart widgets:
- Term::Fabulous::Widget::LineChart, Term::Fabulous::Widget::AreaChart, Term::Fabulous::Widget::BarChart, Term::Fabulous::Widget::ScatterPlot, Term::Fabulous::Widget::Histogram, Term::Fabulous::Widget::Sparkline
-
Charts with an x and a y axis; see Term::Fabulous::Widget::XYChart for everything they share.
- Term::Fabulous::Widget::PieChart, Term::Fabulous::Widget::DonutChart, Term::Fabulous::Widget::PolarAreaChart, Term::Fabulous::Widget::RadarChart
-
Round charts.
A chart is a Term::Fabulous::Widget::Display that draws itself: give it data, and it lays out its title, legend, axes and plot in whatever room the layout gives it, and draws them again whenever the data, an option or its size changes. Only cells that changed are sent to the terminal, so a chart can be updated many times per second. Do not draw into a chart with the canvas methods (put, fill, ...): the chart paints over them in the next frame.
Without a sizing in its layout, a chart grows to the room its parent has left (sizing_grow in both directions); a size given for one direction is kept, and only the other one grows. It has every parameter of a Term::Fabulous::Widget::Box as well (background, border, padding, ...).
Term::Fabulous::Manual::Charts introduces the chart widgets and helps you choose one; Term::Fabulous::Cookbook::Charts, Term::Fabulous::Cookbook::ChartTechniques and Term::Fabulous::Cookbook::ChartStyles have complete programs.
Title and legend
The title is drawn in bold in the chart's first row, at the left, in the center or at the right (title_align). A chart of 12 rows or more leaves an empty row below it; a chart of fewer than 3 rows (such as a sparkline) shows no title.
The legend lists the series (or, in pie charts, the slices) with their colors: a short line for a line series, a square for areas, bars and slices, the point character for scatter series. With legend => 'auto' (the default), a chart shows a legend when it has at least two entries: a single series is named by the title. Charts with axes and radar charts put it at the top; pie, donut and polar area charts on the right. top, bottom, left and right put it there whatever the number of entries; none hides it.
A legend at the top or bottom wraps into more rows when the entries do not fit in one (up to a third of the chart's height); a legend beside the plot lists one entry per row, centered vertically, takes at most half of the chart's width and cuts long labels. When not all entries fit, the legend ends with +N more; a chart too narrow to show even one entry beside that count (about 15 columns) has no legend. A legend at the bottom sits right below the plot, also when the axis ticks leave rows free.
Colors and themes
Every series (or slice) gets the next color of the palette when it is added, and keeps it when other series come and go; a color of its own wins. The palettes are described in Term::Fabulous::Chart::Palette: the default palette's colors are chosen to stay apart for readers with color vision deficiencies. A palette may also be an array of colors of your own, used in their order; their alpha is ignored (give a series a translucent color, or a fill_opacity, for translucency). With more series than the palette has colors (eight in the named palettes), the colors repeat; give such series colors of their own, or better, fewer series.
The chart has no background of its own by default: it is drawn on the background of its nearest ancestor with an opaque one, or on the screen color of the theme ("background_below" in Term::Fabulous::Widget), and blends its translucent fills with it. Set background_color to give it one. The theme chooses between dark and light ink and palette steps; auto (the default) looks at the background and picks light on a light one.
Text and lines that are not data are drawn in colors mixed from the background and the ink of the theme, so they suit any background: the title nearly in the ink color, legend text a little softer, the tick labels and axis titles muted, axis lines faint, grid lines only one shade off the background. Set title_color, text_color, label_color, axis_color or grid_color to use colors of your own.
Hover and emphasis
While the mouse pointer is on a series (its line, area, bars or points, or its legend entry), the chart emphasizes it: the series keeps its color and is drawn on top, the other series fade towards the background (hover_fade of the way, default 0.7), and the series' legend entry is shown in bold. In pie, donut and polar area charts the same happens to slices, and a donut shows the slice's share in its hole. Thin lines can be hit from a cell next to them.
Each time the pointer moves onto something else, the chart fires a SeriesHover event (Term::Fabulous::Event::SeriesHover) with the series, the data point and its value: charts have no tooltips, so this is how a program shows details, for example in a status line.
When the program removes or hides the series (or slice) the pointer is on, the hover ends as if the pointer had moved off it: nothing is faded, hovered returns undef and the chart fires a SeriesHover event without a series.
highlight emphasizes a series from the program the same way, for example the one selected in a list; the pointer wins while it is on a series. hover => 0 turns hover effects and events off; highlight still works.
The chart listens to Mouse and MouseMove events itself to find what the pointer is on, and lets them bubble on, so listeners of your own on the chart and its ancestors still get them.
CONSTRUCTOR
new
All parameters are optional. Besides those of Term::Fabulous::Widget::Box, every chart takes:
title-
A character string, or
undef(the default) for none. See "Title and legend". title_align-
left(the default),centerorright. legend-
auto(the default),top,bottom,left,rightornone. palette-
A palette name (
default, the default,classic,pastelorvivid; see Term::Fabulous::Chart::Palette) or a non-empty array reference of colors in any format a canvas cell takes ("Colors" in Term::Fabulous::Widget::Canvas). theme-
auto(the default),darkorlight: whether the chart's text and lines are light (for a dark background) or dark (for a light one), and which steps of the palette it uses.autopickslightwhen the background is light; see "Colors and themes". title_color,text_color,label_color,axis_color,grid_color-
Colors for the title, the legend text, the tick labels and axis titles, the axis lines and the grid lines, in any format a canvas cell takes. Default:
undef, mixed from the background and the theme's ink (see "Colors and themes"). hover-
True (the default) for hover effects and
SeriesHoverevents. hover_fade-
How far other series fade while one is emphasized: a number from 0 (not at all) to 1 (into the background). Default: 0.7.
highlight-
The name of a series (or the label of a slice) to emphasize, or
undef(the default).
An invalid value dies with a message that names the parameter, for example Term::Fabulous::Widget::LineChart: legend must be auto, bottom, left, none, right, top, got 'center'.
METHODS
Every parameter has an accessor of the same name: without an argument it returns the value, with one it checks and sets it (an invalid value dies and changes nothing), and the chart shows the change in the next frame.
$chart->title('Requests per minute');
$chart->legend('bottom');
$chart->palette( [ '#61afef', '#e06c75' ] );
$chart->label_color(undef);    # back to the color mixed from the background
$chart->highlight(undef);      # nothing emphasized
The color accessors return packed 0xRRGGBB integers, undef for the derived default; palette returns the name or a copy of the array of colors (packed integers). hover(0) also ends a hover in progress: the chart fires a SeriesHover event without a series.
hovered
my $what = $chart->hovered; # { series => 'api', index => 3, label => 'Apr', value => 42 } or undefWhat the mouse pointer is on, with the values the last SeriesHover event had.
effective_background
The background the chart is drawn on, as a packed 0xRRGGBB integer: "background_below" in Term::Fabulous::Widget, so its own, its nearest ancestor's with an opaque one or the screen color of the theme; undef where there is none (in a Term::Fabulous::Static, or under a theme whose background token has alpha 0). The ink is then mixed from a fixed dark surface.
EVENTS
SeriesHover(Term::Fabulous::Event::SeriesHover)-
The pointer moved onto another series, point, slice or legend entry, or off them.
CanvasResize,Mouse,MouseMove-
As for every canvas. A chart draws itself again after a resize; you need not listen.
KDL PROPERTIES
The properties of "KDL PROPERTIES" in Term::Fabulous::Widget::Box, and every parameter of this page: title, title_align, legend, theme, hover (#true or #false), hover_fade, highlight, the color properties title_color, text_color, label_color, axis_color and grid_color, and palette with a palette name or one or more colors:
use Term::Fabulous::Widget::LineChart as LineChart

LineChart "load" {
	title "System load"
	title_align "center"
	legend "bottom"
	theme "dark"
	palette "#61afef" "#e06c75" "#98c379"
	label_color "#8b93a7"
	grid_color "#2a2f3a"
	hover #true
	hover_fade 0.5
	highlight "web"
}
palette "vivid" names a palette. The series and data of a chart are properties of the chart class; see "KDL PROPERTIES" in Term::Fabulous::Widget::XYChart, "KDL PROPERTIES" in Term::Fabulous::Widget::PieChart and "KDL PROPERTIES" in Term::Fabulous::Widget::RadarChart.
SUBCLASS INTERFACE
A chart of your own subclasses this class and provides three methods. The chart calls them while it draws a frame, with a $look hash of the frame's colors: background (the effective background or undef), base (the color fills are blended with), mode (dark or light), title, text, label, axis, grid, palette (the palette's colors), emphasis (the series emphasized, or undef) and fade.
legend_entries($look)-
The legend's entries, as hashes:
series(the name hover reports),label,color,symbol(line,fillorpoint), and optionallyglyph(for points),value(text shown right of the label),raw_valueandindex. default_legend_position-
top,bottom,leftorright: whereautoputs the legend. draw_plot( $surface, $x, $y, $width, $height, $look )-
Draws the plot into the area of a Term::Fabulous::Chart::Surface. Returns the number of rows it used from the top of the area, or nothing when it used all of them: a legend at the bottom follows the used rows.
Helpers: slot_color( $look, $slot ) (the palette's color for a slot), shown_color( $look, $series, $rgb ) (faded unless the series is emphasized), is_emphasized( $look, $series ) and register_target( series => ..., index => ..., label => ..., value => ..., x => ... ), which returns an owner id to record in the surface's owner maps, so the pointer finds what was drawn there.
A chart whose program can take series or slices away calls end_hover_unless_shown(@names) after it did, with the names (the series of the targets) of everything still shown: when the pointer is on something that is not among them, the hover ends as described in "Hover and emphasis".
SEE ALSO
"CHARTS" in Term::Fabulous::Manual::Charts (the guide), Term::Fabulous::Widget::XYChart, Term::Fabulous::Widget::PieChart, Term::Fabulous::Widget::RadarChart, Term::Fabulous::Chart::Palette, Term::Fabulous::Event::SeriesHover, Term::Fabulous::Cookbook::Charts, Term::Fabulous::Cookbook::ChartTechniques, Term::Fabulous::Cookbook::ChartStyles, the example program examples/widgets/chart.pl.