NAME
Term::Fabulous::Widget::LineChart - A chart of lines through data points
SYNOPSIS
use Term::Fabulous::Widget::LineChart;

my $chart = Term::Fabulous::Widget::LineChart->new(
	title  => 'Monthly active users',
	labels => [qw(Jan Feb Mar Apr May Jun Jul Aug Sep Oct Nov Dec)],
	curve  => 'monotone',
	y_axis => { title => 'thousands' },
	series => [
		{ name => 'Web',     data => [ 120, 132, 151, 149, 170, 205, 261, 252, 196, 178, 164, 183 ] },
		{ name => 'iOS',     data => [ 82,  97,  108, 141, 166, 192, 228, 247, 223, 206, 214, 238 ] },
		{ name => 'Android', data => [ 31,  35,  41,  57,  62,  61,  74,  88,  95,  113, 128, 141 ] },
	],
);

$chart->append( 'Jan 27', { Web => 190, iOS => 241, Android => 150 } );    # a 13th month
$chart->set_series( iOS => ( line_style => 'dashed', points => 1 ) );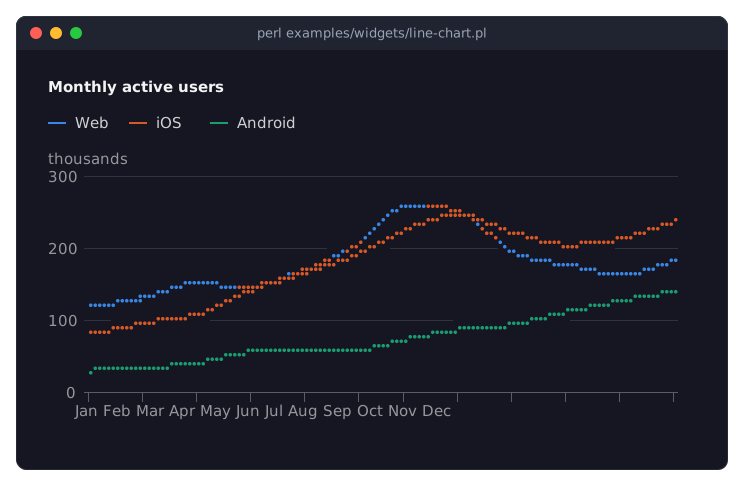
The program is examples/widgets/line-chart.pl.
DESCRIPTION
A line chart shows how values change along the x axis: over time, over categories or over a number. Each series is a line through its points, drawn in Braille dots (a quarter of a cell wide, an eighth of a cell high), straight between the points or along a curve; the y axis does not include zero unless asked to, so the differences between values stay visible.
Everything a line chart does is described on Term::Fabulous::Widget::XYChart: the series and their data forms, category, numeric and time axes, curves, line styles, points, rendering styles, transforms, live data, hover. A LineChart is an XYChart whose series are line series unless they say otherwise; a line chart may also carry area, bar and scatter series.
CONSTRUCTOR
new
my $chart = Term::Fabulous::Widget::LineChart->new(%parameters);The parameters of "CONSTRUCTOR" in Term::Fabulous::Widget::XYChart and "CONSTRUCTOR" in Term::Fabulous::Widget::Chart. The options that matter most for lines: curve, line_style, points and point, marker (braille by default, or box for a chart of box drawing characters), span_gaps, max_points.
METHODS
Those of "METHODS" in Term::Fabulous::Widget::XYChart.
KDL PROPERTIES
use Term::Fabulous::Widget::LineChart as LineChart

LineChart "users" {
	title "Monthly active users"
	labels "Jan" "Feb" "Mar" "Apr"
	curve "monotone"
	series "Web" { data 120 132 151 149 }
	series "iOS" line_style="dashed" { data 82 97 108 141 }
}
See "KDL PROPERTIES" in Term::Fabulous::Widget::XYChart.
SEE ALSO
Term::Fabulous::Widget::XYChart, Term::Fabulous::Widget::AreaChart, Term::Fabulous::Widget::Sparkline, "CHARTS" in Term::Fabulous::Manual::Charts, "Draw a line chart with labels and points (LineChart)" in Term::Fabulous::Cookbook::Charts.