NAME
Term::Fabulous::Widget::BarChart - Values as bars, grouped, stacked or horizontal
SYNOPSIS
use Term::Fabulous::Widget::BarChart;

my $chart = Term::Fabulous::Widget::BarChart->new(
	title        => 'Revenue by quarter',
	labels       => [qw(Q1 Q2 Q3 Q4)],
	value_labels => 1,
	y_axis       => { title => 'million EUR' },
	series       => [
		{ name => '2025', data => [ 42.5, 51.2, 48.0, 63.4 ] },
		{ name => '2026', data => [ 47.1, 58.3, 61.0, 72.2 ] },
	],
);

$chart->add_series( name => 'Target', type => 'line', data => [ 50, 55, 60, 65 ] );    # a line over the bars
$chart->remove_series('Target');
$chart->stacked(1);       # 2026 on top of 2025
$chart->horizontal(1);    # categories down the left; only bar series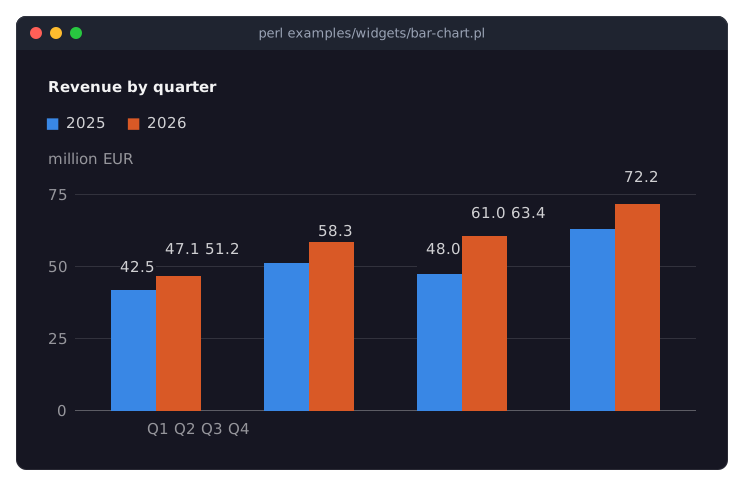
The program is examples/widgets/bar-chart.pl.
DESCRIPTION
A bar chart compares values across categories. Each category has a slot on the x axis; the bars of several series stand side by side in it (grouped), or on each other with stacked. Bars grow from zero (or from the baseline, downwards for negative values), in block characters placed to an eighth of a cell, and are opaque. On a numeric or time x axis, bars are centered on their x, in slots as wide as the smallest distance between two bars.
Options for bars: value_labels writes each bar's value above it (a stack's total); bar_width (0 to 1, default 0.7) is the share of the slot the bars take; horizontal turns the chart on its side, for long category names or many categories; stack on a series puts it in a named stack group; marker changes the character set. Everything else, including the axes and live data, is described on Term::Fabulous::Widget::XYChart; a BarChart is an XYChart whose series are bar series unless they say otherwise. A horizontal chart shows bar series only. The options are described with pictures in "LOOKS" in Term::Fabulous::Widget::XYChart.
For the distribution of values, use Term::Fabulous::Widget::Histogram, which counts them into bins first.
CONSTRUCTOR
new
my $chart = Term::Fabulous::Widget::BarChart->new(%parameters);The parameters of "CONSTRUCTOR" in Term::Fabulous::Widget::XYChart and "CONSTRUCTOR" in Term::Fabulous::Widget::Chart. For bars: labels, stacked, horizontal, bar_width, value_labels, fill_opacity, marker.
METHODS
Those of "METHODS" in Term::Fabulous::Widget::XYChart.
KDL PROPERTIES
use Term::Fabulous::Widget::BarChart as BarChart

BarChart "revenue" {
	labels "Q1" "Q2" "Q3" "Q4"
	value_labels #true
	horizontal #false
	bar_width 0.6
	series "2025" { data 42.5 51.2 48 63.4 }
	series "2026" { data 47.1 58.3 61 72.2 }
}
See "KDL PROPERTIES" in Term::Fabulous::Widget::XYChart.
SEE ALSO
Term::Fabulous::Widget::XYChart, Term::Fabulous::Widget::Histogram, "CHARTS" in Term::Fabulous::Manual::Charts, "Grouped, stacked and horizontal bars (BarChart)" in Term::Fabulous::Cookbook::Charts.