NAME
Term::Fabulous::Chart::Transform - Prepare the data of a chart series: normalize, smooth, accumulate, resample
SYNOPSIS
# In a chart, as the transform of a series (or of all series):
use Term::Fabulous::Widget::LineChart;

my $chart = Term::Fabulous::Widget::LineChart->new(
	series => [
		{ name => 'Raw',      data => \@samples },
		{ name => 'Smoothed', data => \@samples, transform => [ [ 'moving_average', 7, 'center' ] ] },
		{ name => 'Indexed',  data => \@prices,  transform => [ 'sort', [ 'index', 100 ] ] },
	],
);

# On its own:
use Term::Fabulous::Chart::Transform qw(parse_transforms apply_transforms);

my $steps = parse_transforms( 'my program', 'transform', [ [ 'resample', 3600, 'sum' ], 'cumulative' ] );
my ( $xs, $ys ) = apply_transforms( $steps, \@epochs, \@values );
DESCRIPTION
A series can be prepared before it is drawn: smoothed, normalized, summed up, resampled to an interval, thinned out. The transform of a series (or of the whole chart, for every series without one of its own) lists the steps, which run in order on the series' points. The data you give the chart is kept as it is: the steps run again whenever it changes, so live data stays prepared the same way. How the chart uses the prepared points is described in "Preparing data" in Term::Fabulous::Widget::XYChart.
A step is a name, an array of a name and its arguments, or a code reference. Write the list of steps as an array, even for one step with arguments: transform => [ [ 'moving_average', 5 ] ]. A single step without arguments can stand alone: transform => 'cumulative'. transform => [ 'moving_average', 5 ] dies with a message that shows the right form. Unknown names, a wrong number of arguments and invalid arguments die when the transform is given.
In a KDL layout, each transform node is one step, its name and arguments as the node's arguments; repeat the node for several steps (see "KDL PROPERTIES" in Term::Fabulous::Widget::XYChart):
series "visits" {
	data 120 135 160 158 171 190 185
	transform "moving_average" 3 "center"
	transform "index" 100
}
The steps see the x values as numbers: the positions 0, 1, 2, ... of points without x, the category numbers on a category axis, epoch seconds on a time axis. Points without a value (undef, gaps in a line) stay gaps unless a step says otherwise; windows skip them.
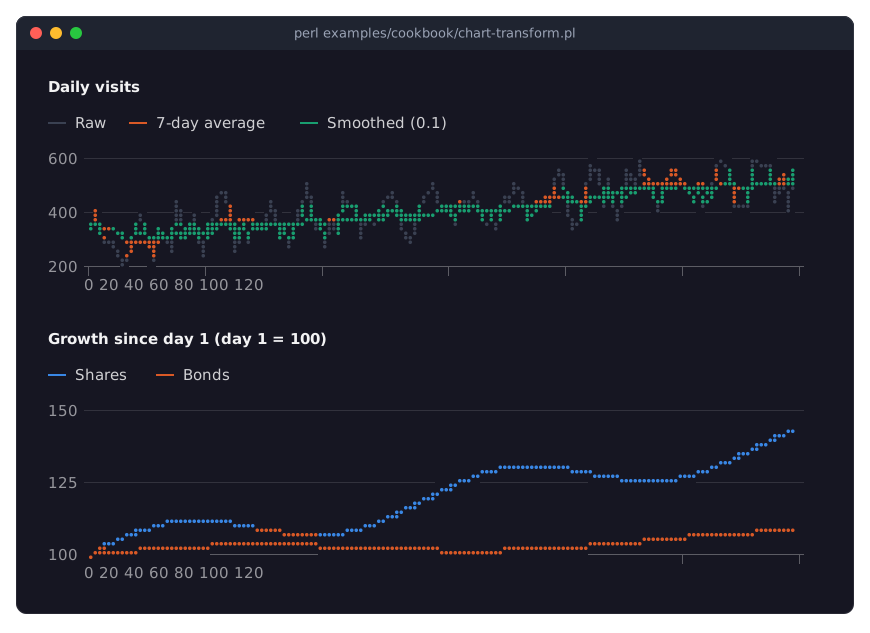
The program in the picture is in "Smooth noisy data and index it to 100 (transforms)" in Term::Fabulous::Cookbook::ChartTechniques.
Steps
Each example shows the y values a step makes of the y values before it; the x values are 0, 1, 2, ... unless the example gives them.
normalize,[ 'normalize', $low, $high ]-
Scales the values linearly so the smallest becomes
$lowand the largest$high(default 0 and 1); when all values are equal, all become$low. Use it to compare the shapes of series of different sizes on one axis.transform => 'normalize' # 2, 4, 6, 8, 10 => 0, 0.25, 0.5, 0.75, 1 transform => [ [ 'normalize', 0, 100 ] ] # 2, 4, 6, 8, 10 => 0, 25, 50, 75, 100 -
Each value as a fraction of the total of the absolute values of the series (0 to 1); with the axis
format => 'percent'the axis shows percentages.transform => 'share' # 1, 2, 3, 4 => 0.1, 0.2, 0.3, 0.4 zscore-
The number of standard deviations (of the whole series) each value lies from the series mean; when all values are equal, all become 0.
transform => 'zscore' # 2, 4, 4, 6 => -1.41, 0, 0, 1.41 index,[ 'index', $base ]-
Each value relative to the first non-zero value, which becomes
$base(default 100). Use it instead of a second axis to compare the growth of series of different sizes: all start at 100.transform => 'index' # 40, 50, 60 => 100, 125, 150 transform => [ [ 'index', 1 ] ] # 40, 50, 60 => 1, 1.25, 1.5 cumulative-
The running total.
transform => 'cumulative' # 1, 2, undef, 3 => 1, 3, undef, 6 difference-
The change from the previous value; the first point gets none (a gap). After a gap, the change is counted from the last value before it.
transform => 'difference' # 5, 7, 4, 10 => undef, 2, -3, 6 rate,[ 'rate', $per ]-
The change per unit of x from the previous point, times
$per(default 1): a counter sampled with epoch seconds becomes a rate per second, with[ 'rate', 60 ]per minute. The first point, and a point at the same x as the one before, get none.transform => 'rate' # x 0, 10, 20; y 100, 160, 190 => undef, 6, 3 transform => [ [ 'rate', 60 ] ] # x 0, 10, 20; y 100, 160, 190 => undef, 360, 180 [ 'moving_average', $window ],[ 'moving_average', $window, 'center' ]-
The mean of the last
$windowvalues (trailing, the default), or of the$windowvalues around each point (center), which does not lag behind.$windowis a whole number of points, at least 1. At the ends, where fewer values are at hand, the mean is taken of those there are.transform => [ [ 'moving_average', 3 ] ] # 3, 6, 9, 6, 3 => 3, 4.5, 6, 7, 6 transform => [ [ 'moving_average', 3, 'center' ] ] # 3, 6, 9, 6, 3 => 4.5, 6, 7, 6, 4.5 [ 'exponential', $alpha ]-
Exponential smoothing: each value moves
$alpha(greater than 0, at most 1) of the way from the smoothed value before it towards its own value; the first value stays. Small values smooth more.transform => [ [ 'exponential', 0.5 ] ] # 10, 20, 20, 0 => 10, 15, 17.5, 8.75 [ 'median', $window ]-
The median of the
$windowvalues around each point (a whole number of points, at least 1): removes single spikes but keeps steps.transform => [ [ 'median', 3 ] ] # 1, 1, 9, 1, 1 => 1, 1, 1, 1, 1 [ 'gaussian', $sigma ]-
A Gaussian blur with a standard deviation of
$sigmapoints (a positive number); each value is the weighted mean of the values up to three$sigmaaway. The smoothest of the smoothing steps.transform => [ [ 'gaussian', 1 ] ] # 0, 0, 10, 0, 0 => 0.77, 2.57, 4.03, 2.57, 0.77 [ 'scale', $factor ],[ 'offset', $amount ]-
Multiply by a number or add a number, for example to convert units.
transform => [ [ 'scale', 1000 ] ]           # 1.5, 2, 2.5  =>  1500, 2000, 2500
transform => [ [ 'offset', -273.15 ] ]       # 293.15, 300  =>  20, 26.85
[ 'clip', $low, $high ]-
Limits the values to a range; either end may be
undeffor no limit.$lowmust not be greater than$high.transform => [ [ 'clip', 0, 100 ] ] # -5, 50, 120, 80 => 0, 50, 100, 80 transform => [ [ 'clip', undef, 100 ] ] # -5, 50, 120, 80 => -5, 50, 100, 80 abs-
The absolute values.
transform => 'abs' # -3, 0, 2 => 3, 0, 2 sort-
Sorts the points by x. Lines and areas on numeric and time axes are sorted anyway; use it before steps that depend on the order, such as
cumulativeorindex, on bars or points.transform => 'sort' # x 3, 1, 2; y 30, 10, 20 => x 1, 2, 3; y 10, 20, 30 [ 'resample', $interval ],[ 'resample', $interval, $aggregate ]-
Groups the points into intervals of x (
3600for hours of epoch seconds) and replaces each group by one point at the start of its interval: themean(default),sum,min,max,first,lastvalue or thecountof points. Intervals without points are left out; a group of gaps only is a gap (acountof 0).transform => [ [ 'resample', 10 ] ] # x 1, 4, 12, 15, 27; y 1, 3, 5, 7, 9 => x 0, 10, 20; y 2, 6, 9 transform => [ [ 'resample', 10, 'sum' ] ] # same points => x 0, 10, 20; y 4, 12, 9 transform => [ [ 'resample', 10, 'count' ] ] # same points => x 0, 10, 20; y 2, 2, 1 [ 'downsample', $count ]-
Thins a long series out to
$countpoints (a whole number, at least 3) with the Largest-Triangle-Three-Buckets method, which keeps peaks and dips. The first and the last point stay; gaps are dropped. A series of$countpoints or fewer only loses its gaps. Charts draw any number of points; this only makes drawing faster.transform => [ [ 'downsample', 3 ] ] # 1, 5, 2, 8, 3, 4 => x 0, 3, 5; y 1, 8, 4 regression-
The least-squares straight line through the points, at every x of the series (gaps get a value too). A series with fewer than two values becomes gaps only. The series option
trenddraws such a line in addition to the series.transform => 'regression' # 1, 3, 2, 4 => 1.3, 2.1, 2.9, 3.7 - a code reference
-
Called with copies of the x and y values as two array references; returns two array references of equal length, the new x and y values. Anything else dies when the frame is drawn.
transform => [ sub ( $xs, $ys ) { return ( $xs, [ map { defined ? $_ * 2 : undef } @$ys ] ) } ]
FUNCTIONS
parse_transforms
my $steps = parse_transforms( $owner, $name, $spec );Checks a specification and returns its steps. Dies with $owner and $name in the message for unknown names and wrong arguments.
apply_transforms
my ( $xs, $ys ) = apply_transforms( $steps, \@xs, \@ys );Runs the steps on the values and returns new arrays.
transform_names
The names of all steps, sorted.
SEE ALSO
"Preparing data" in Term::Fabulous::Widget::XYChart, "Series and data" in Term::Fabulous::Manual::Charts, "Smooth noisy data and index it to 100 (transforms)" in Term::Fabulous::Cookbook::ChartTechniques, Term::Fabulous::Chart::Curve.