NAME
Term::Fabulous::Widget::Histogram - How values are distributed: counts in bins
SYNOPSIS
use Term::Fabulous::Widget::Histogram;

my $chart = Term::Fabulous::Widget::Histogram->new(
	title  => 'Response times',
	x_axis => { title => 'milliseconds' },
	y_axis => { title => 'requests' },
	series => [
		{ name => 'eu-west', data => \@durations_eu },    # plain numbers: the observations
		{ name => 'us-east', data => \@durations_us },
	],
);

$chart->bin_width(25);                    # bins 25 ms wide
$chart->range( [ 0, 500 ] );              # from 0 to 500 ms
$chart->measure('percent');               # the share of the observations per bin
$chart->cumulative(1);                    # running total: a distribution function
$chart->add_points( 'eu-west', 131.5 );  # bins are counted again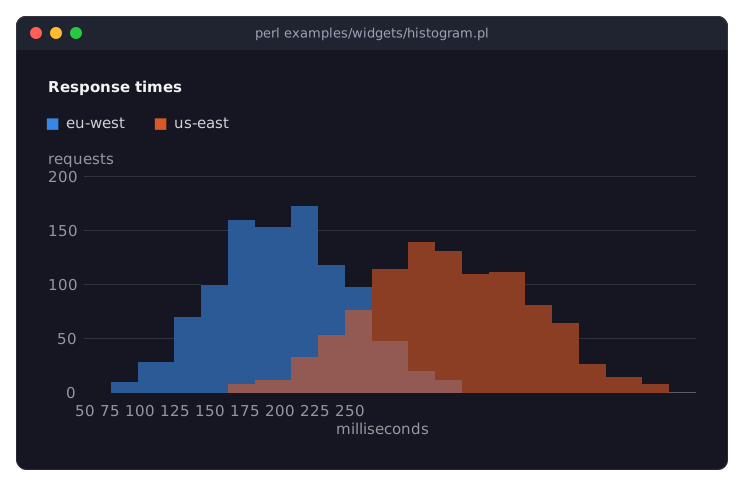
examples/widgets/histogram.pl draws this chart.
DESCRIPTION
A histogram shows how a set of numbers is distributed: the x axis is divided into bins of equal width, and each bin is a bar as high as the number of observations that fall into it. Give each series its observations as plain numbers (undef values are skipped); the chart counts them when a frame is drawn, and counts again when the data or the bins change. [ x, y ] pairs and hashes die when they are given: a histogram has no x values of its own.
Bins
By default the chart chooses the bin width from the data (the Freedman-Diaconis rule: twice the interquartile range over the cube root of the count, rounded to 1, 2, 2.5 or 5 times a power of ten, at most fifty bins), and the bins start at a multiple of that width. bins asks for a number of bins over the data's range, bin_width for a width, range fixes the ends. A bin holds the values from its left edge up to, but not including, its right edge; the last bin includes its right edge too. With range and a bin_width that does not divide it, the last bin is narrower.
A histogram has at most 1000 bins, more than any terminal shows. bins takes no more, and a bin_width is a lower bound: when the data (or the range) would need more than 1000 bins of that width, the chart uses the smallest round width (1, 2, 2.5 or 5 times a power of ten) that needs at most 1000.
With several series, the same bins count every series, and the bars of different series overlap, translucent (60% opaque), so both distributions are visible; with stacked (see "STACKING" in Term::Fabulous::Widget::XYChart) they stack, opaque.
Measures
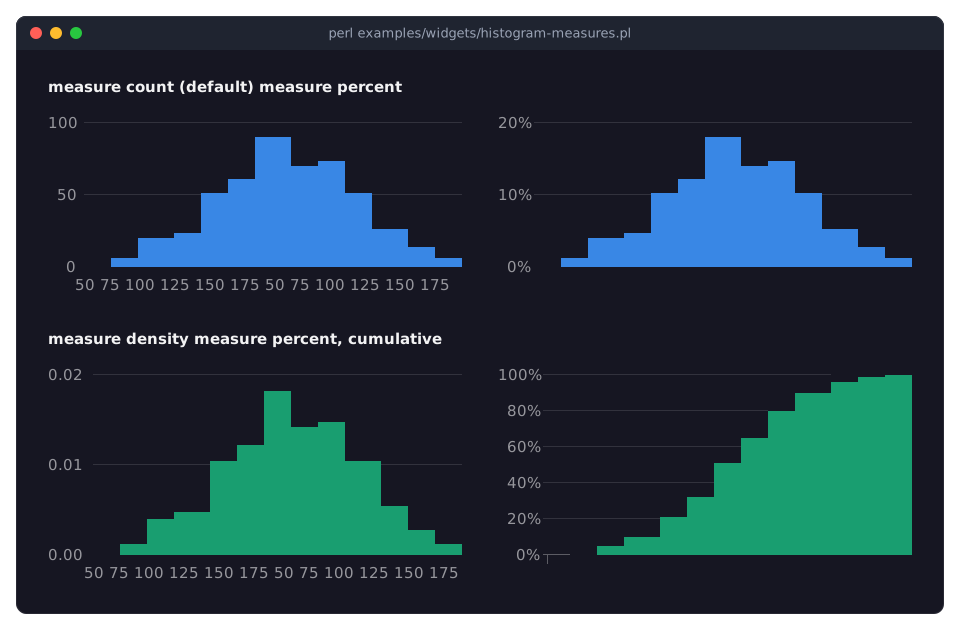
measure decides what a bar's height is: the count of observations, their percent of the series (as a fraction from 0 to 1; the axis and the value labels show percentages), or the density (the share divided by the bin width, so the area under the histogram is 1 and bins of different widths compare). cumulative accumulates the bins from the left: with percent the last bar reaches 100%, which reads as "the share of the observations below this value". examples/widgets/histogram-measures.pl shows the four forms.
What a histogram shares with the XY charts
A Histogram is a Term::Fabulous::Widget::XYChart of bar series, with the x axis fixed to numbers from the first bin's left edge to the last bin's right edge, so labels, horizontal and the other series types are not for it; the axis keys, value_labels, marker, fill_opacity, transforms (run on the observations before they are counted) and hover work as described there. Hover reports the bin as the point: its range (such as 100-125, written with an en dash) as the label, the height of its bar in the chosen measure as the value, its number (from 0) as the index and its middle as the x.
CONSTRUCTOR
new
my $chart = Term::Fabulous::Widget::Histogram->new(%parameters);The parameters of "CONSTRUCTOR" in Term::Fabulous::Widget::XYChart and "CONSTRUCTOR" in Term::Fabulous::Widget::Chart, and:
bins-
auto(the default) or a positive integer up to 1000: the number of bins of equal width from the smallest to the largest observation (or overrange).autochooses a round bin width; see "Bins". bin_width-
A positive number: the width of every bin, widened for data that would need more than 1000 bins (see "Bins"). Default:
undef, which letsbinsdecide. When given,binsis not used. range-
[ $low, $high ]with$lowbelow$high: the left edge of the first bin and the right edge of the last. Observations outside are not counted. Default:undef, the smallest and largest observation; withbins => 'auto'or abin_width, rounded out to multiples of the bin width. measure-
count(the default),percentordensity; see "Measures". cumulative-
A boolean: true adds every bin to the ones left of it. Default: false.
METHODS
bins, bin_width, range, measure and cumulative read and set the parameters (range returns a copy; undef restores the default of bin_width and range; an invalid value dies and changes nothing), and the methods of "METHODS" in Term::Fabulous::Widget::XYChart manage the series.
bin_edges
my @edges = $chart->bin_edges( \@durations_eu, \@durations_us ); # 0, 25, 50, ...The edges of the bins the chart's settings give for the observations passed, one array reference of numbers per series: one value more than there are bins, the first the left edge of the first bin and the last the right edge of the last. The chart calls it with the observations of its visible series (after their transforms) whenever it is drawn; call it yourself to label or to count things the way the chart does.
KDL PROPERTIES
use Term::Fabulous::Widget::Histogram as Histogram

Histogram "latency" {
	bin_width 25
	range 0 500
	measure "percent"
	cumulative #false
	series "eu-west" { data 120 131 98 145; }
	series "us-east" { data 170 182 151 199; }
}
bins ("auto" or a number), bin_width, measure, cumulative as the parameters, range with the low and the high value as its arguments, and the properties of "KDL PROPERTIES" in Term::Fabulous::Widget::XYChart.
SEE ALSO
Term::Fabulous::Widget::XYChart, Term::Fabulous::Widget::BarChart, Term::Fabulous::Widget::Chart (title, legend, colors, hover), "CHARTS" in Term::Fabulous::Manual::Charts, "How values are distributed (Histogram)" in Term::Fabulous::Cookbook::Charts, the example programs examples/widgets/histogram.pl and examples/widgets/histogram-measures.pl.