NAME
Term::Fabulous::Widget::PolarAreaChart - Slices of equal angle whose length shows their value
SYNOPSIS
use Term::Fabulous::Widget::PolarAreaChart;

my $chart = Term::Fabulous::Widget::PolarAreaChart->new(
	title => 'Commits by weekday',
	data  => [ [ Monday => 34 ], [ Tuesday => 41 ], [ Wednesday => 38 ], [ Thursday => 45 ], [ Friday => 29 ], [ Saturday => 9 ], [ Sunday => 6 ] ],
);

$chart->max(50);      # the value of the outer ring
$chart->ticks(5);     # about five rings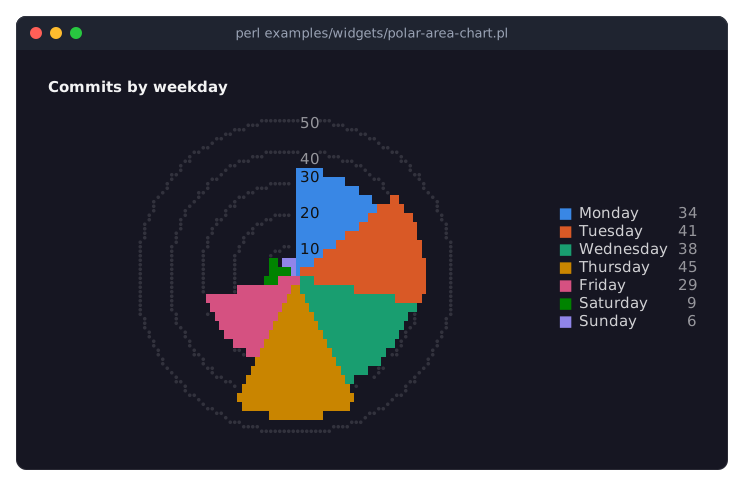
examples/widgets/polar-area-chart.pl draws this chart.
DESCRIPTION
A polar area chart (a Nightingale rose) gives every slice the same angle and lets its value decide how far from the center it reaches, so values of the same kind, such as counts per month or per weekday, compare by length and by area around a circle. Dotted rings mark round values behind the slices, and the value of each ring is written along the line to 12 o'clock; the legend on the right lists the slices with their values.
It is a Term::Fabulous::Widget::PieChart: the data forms, sort, other, start_angle, gap, marker, format, the methods and events are the same, except that the slices show no labels by default (slice_labels is none, the rings tell the values) and the legend shows the values (legend_values is value). The ring values are written with the chart's format. Hover reports a slice as in a pie chart: its label as the series and the label, its value as the value.
Use it for values of one kind over categories that form a cycle (hours, weekdays, months, compass directions); for parts of a whole use a Term::Fabulous::Widget::PieChart, and to compare several series over the same categories a Term::Fabulous::Widget::RadarChart.
CONSTRUCTOR
new
my $chart = Term::Fabulous::Widget::PolarAreaChart->new(%parameters);The parameters of "CONSTRUCTOR" in Term::Fabulous::Widget::PieChart, and:
max-
A positive number: the value at the outer edge; a slice of this value reaches the edge. Default:
undef, a round value at or above the largest slice. A slice larger thanmaxis cut at the edge. ticks-
A positive integer: about how many rings you want; the chart picks the round step that comes closest. Default:
undef, which spaces the rings two to three rows apart, so a larger chart has more of them.
METHODS
max and ticks read and set the parameters (undef restores the default; an invalid value dies and changes nothing), and the methods of "METHODS" in Term::Fabulous::Widget::PieChart manage the slices.
$chart->max(undef); # from the data againKDL PROPERTIES
use Term::Fabulous::Widget::PolarAreaChart as PolarAreaChart

PolarAreaChart "commits" {
	max 50
	ticks 5
	slice "Monday" 34
	slice "Tuesday" 41
}
max and ticks as the parameters, and the properties of "KDL PROPERTIES" in Term::Fabulous::Widget::PieChart.
SEE ALSO
Term::Fabulous::Widget::PieChart, Term::Fabulous::Widget::RadarChart, Term::Fabulous::Widget::Chart, "CHARTS" in Term::Fabulous::Manual::Charts, "Compare profiles on radar and polar area charts (RadarChart, PolarAreaChart)" in Term::Fabulous::Cookbook::Charts, the example program examples/widgets/polar-area-chart.pl.