NAME
Term::Fabulous::Widget::ScatterPlot - Points by two numbers, with trend lines
SYNOPSIS
use Term::Fabulous::Widget::ScatterPlot;

my $chart = Term::Fabulous::Widget::ScatterPlot->new(
	title  => 'Power and fuel use',
	x_axis => { title => 'Engine power (kW)' },
	y_axis => { title => 'l/100 km' },
	series => [
		{ name => 'Petrol', data => [ [ 110, 7.1 ], [ 85, 6.2 ], [ 160, 8.4 ] ], trend => 1 },
		{ name => 'Hybrid', data => [ [ 90, 4.1 ], [ 140, 5.0 ], [ 70, 3.6 ] ], trend => 1 },
	],
);

$chart->point('x');    # a character instead of the Braille square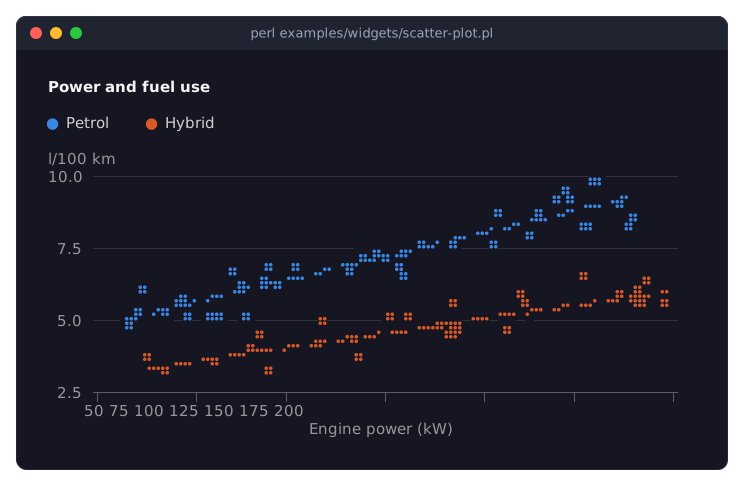
The program is examples/widgets/scatter-plot.pl.
DESCRIPTION
A scatter plot shows every observation as one point at its x and y value, for the relation between two numbers. Points are [ x, y ] pairs on numeric axes (a category x axis works too, with labels). Each point is a square of four Braille dots by default, placed to a quarter of a cell; point makes it a single dot or any character. trend on a series adds the least-squares line through its points, dashed, from the first x to the last. Neither axis includes zero unless asked to.
For series of tens of thousands of points, the downsample transform of Term::Fabulous::Chart::Transform keeps the shape and draws faster. Everything else is described on Term::Fabulous::Widget::XYChart; a ScatterPlot is an XYChart whose series are scatter series unless they say otherwise, so a line series can draw a model over the observations.
CONSTRUCTOR
new
my $chart = Term::Fabulous::Widget::ScatterPlot->new(%parameters);The parameters of "CONSTRUCTOR" in Term::Fabulous::Widget::XYChart and "CONSTRUCTOR" in Term::Fabulous::Widget::Chart. For points: point, marker (braille by default), and trend on each series.
METHODS
Those of "METHODS" in Term::Fabulous::Widget::XYChart.
KDL PROPERTIES
use Term::Fabulous::Widget::ScatterPlot as ScatterPlot

ScatterPlot "cars" {
	x_axis title="kW"
	point "dot"
	series "Petrol" trend=#true {
		point 110 7.1
		point 85 6.2
	}
}
See "KDL PROPERTIES" in Term::Fabulous::Widget::XYChart.
SEE ALSO
Term::Fabulous::Widget::XYChart, Term::Fabulous::Chart::Transform, "CHARTS" in Term::Fabulous::Manual::Charts, "A scatter plot with trend lines (ScatterPlot)" in Term::Fabulous::Cookbook::Charts.