NAME
Term::Fabulous::Widget::PieChart - A pie chart: parts of a whole as slices
SYNOPSIS
use Term::Fabulous::Widget::PieChart;

my $chart = Term::Fabulous::Widget::PieChart->new(
	title => 'Visitors by browser',
	sort  => 'desc',                       # the largest slice first
	other => 0.03,                         # slices below 3% fold into "Other"
	data  => [
		[ Chrome  => 6420 ],
		[ Safari  => 1830 ],
		[ Firefox => 1210 ],
		[ Edge    => 980 ],
		[ Opera   => 160 ],
		[ Vivaldi => 90 ],
	],
);

$chart->set_value( Chrome => 6500 );
$chart->add_slice( Brave => 120, '#f5a623' );
$chart->remove_slice('Opera');
say $chart->total;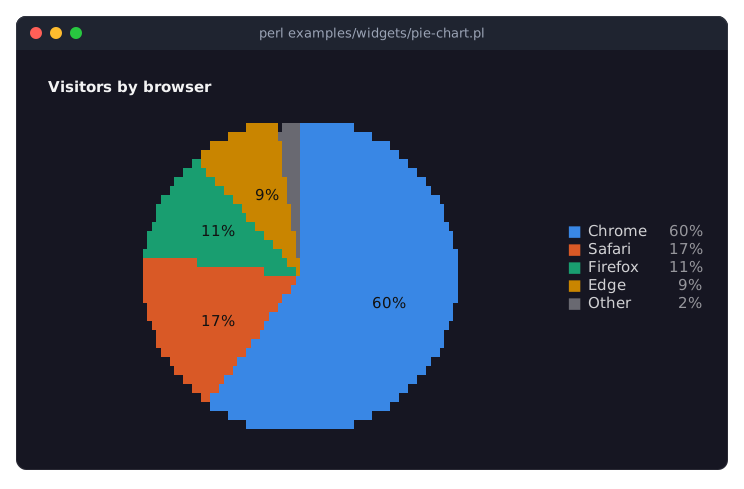
examples/widgets/pie-chart.pl draws this chart.
DESCRIPTION
A pie chart shows how a whole divides into parts: each slice's angle is its share of the total. The slices go clockwise from 12 o'clock (start_angle turns them), in the order given or sorted by value, each with the next color of the palette. The pie is as large a circle as the room allows, drawn in quadrant blocks (two by two per cell; marker chooses finer characters), with its share written on every slice that has room for it and a legend on the right that lists the slices with their shares. The slices are the "series" of this chart: hover emphasizes one and fades the others, and SeriesHover reports its label and value.
Pies read well with up to about six slices. other folds the small ones into one slice labeled other_label, when at least two are below that share; that slice comes last and is gray. Slices with a value of 0 are neither drawn nor listed in the legend.
Styles
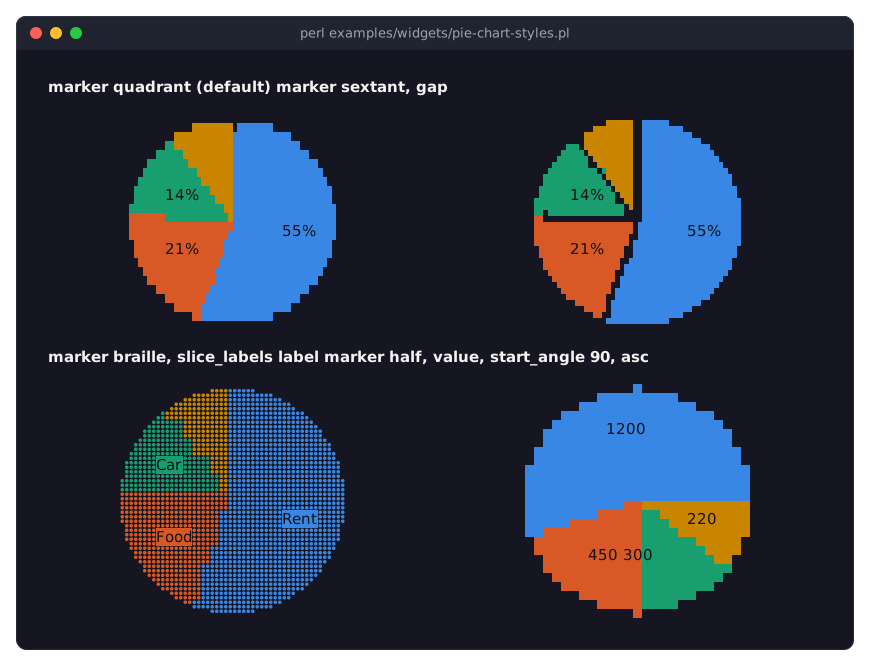
examples/widgets/pie-chart-styles.pl draws the same slices four ways. marker chooses the characters: quadrant blocks (2 x 2 subpixels per cell, the default), sextant (2 x 3), braille dots (2 x 4, finest, but one color per cell, so slice edges look dotted) or half blocks (1 x 2). gap separates the slices by a thin line of background. slice_labels writes the share, the value or the label on each slice that has room for it, sort orders the slices by value, and start_angle turns the whole pie.
Term::Fabulous::Widget::DonutChart is a pie with a hole for a text in the middle; Term::Fabulous::Widget::PolarAreaChart gives every slice the same angle and shows the value as its length.
Data
data => [ 6420, 1830 ], labels => [ 'Chrome', 'Safari' ], colors => [ '#3987e5', '#d95926' ]
data => [ [ Chrome => 6420 ], [ Safari => 1830 ] ]
data => [ { label => 'Chrome', value => 6420, color => '#3987e5' } ]
A slice has a label (unique, not empty), a value (a number of at least 0) and optionally a color; give the data as plain values (named by labels, else Slice 1, Slice 2, ...), as [ label, value ] pairs, or as hashes. colors names the colors of the plain or pair forms by position.
A slice keeps its palette color for as long as its label is in the chart, also when other slices come and go and when set_data replaces the data; so a slice stays recognizable while its value changes. A label that is removed and added again gets the next free color.
Invalid data dies with a message that names the slice, for example the value of slice 'Chrome' must be a number of at least 0, got '-5', and so does a label used twice.
CONSTRUCTOR
new
my $chart = Term::Fabulous::Widget::PieChart->new(%parameters);The parameters of "CONSTRUCTOR" in Term::Fabulous::Widget::Chart (the legend is on the right by default), and:
data,labels,colors-
The slices; see "Data". Default: none.
hole-
A number from 0 to 0.9: the radius of the hole in the middle as a share of the pie's radius. Default: 0 (0.6 for a donut). A hole whose radius is at least three cell widths shows a text; see
center_text. start_angle-
Degrees clockwise from 12 o'clock where the first slice starts. Default: 0.
sort-
none(the default: the order given),desc(the largest first) orasc. slice_labels-
What is written on the slices:
percent(the default),value,labelornone. A text is only written where it fits inside its slice. legend_values-
What the legend shows right of each label:
percent(the default),value,both(the value and the share, in aligned columns) ornone. center_text-
For a chart with a hole (a donut): the text in the hole, lines separated by newlines; the first line is bold. Default:
undef, which shows the total with the wordTotalbelow it, or, while a slice is emphasized (by the pointer or byhighlight), its share and label. An empty string shows nothing. Lines longer than the hole is wide are cut. marker-
quadrant(the default),half,sextantorbraille: the characters the slices are drawn with. Sextants are smoother; Braille dots are finest but show one color per cell. other-
A share from 0 to 1. Slices below it are folded into one slice when at least two of them exist. Default: 0 (never).
other_label-
The label of that slice;
undefmeans the default,Other. gap-
A boolean: a thin gap between the slices. Default: false. The gap is at least one subpixel of the marker wide, so it is finest with
sextantorbraille. format-
How values are written (on slices, in the legend, in the center): a format of Term::Fabulous::Chart::Format:
si,integer,percent, asprintfformat such as'%d €', or a code reference that gets the value and returns the text. Default:undef, up to two decimals (three significant digits below 1) and SI prefixes from a million on (1.2M). Shares are always written as whole percentages,<1%for a share below one percent.
METHODS
Every parameter except the data has an accessor of the same name: without an argument it returns the value, with one it checks and sets it; an invalid value dies and changes nothing. The chart shows every change in the next frame.
$chart->sort('desc');
$chart->slice_labels('value');
$chart->hole(0.5);
set_data
$chart->set_data( \@data, \@labels, \@colors );Replaces all slices; see "Data". Dies without changing anything for invalid data. When the mouse pointer is on a slice whose label is gone, the hover ends (see "Hover and emphasis" in Term::Fabulous::Widget::Chart).
set_value
$chart->set_value( Chrome => 6500 );Changes a slice's value; adds the slice when the label is new. Returns the chart.
add_slice, remove_slice, clear_slices
$chart->add_slice( $label, $value, $color );
$chart->remove_slice( 'Opera', 'Vivaldi' );
$chart->clear_slices;
add_slice adds a slice at the end (the color is optional) and dies when the label exists already. remove_slice removes the slices with these labels and dies, removing none, when one of them does not exist. clear_slices removes all. They return the chart. Removing the slice the mouse pointer is on ends the hover.
set_slice_color
$chart->set_slice_color( Chrome => '#4285f4' );A color, or undef for the palette color again. Dies for an unknown label.
slices, value, total
my @slices = $chart->slices;    # ( { label => 'Chrome', value => 6420, color => '#3987e5' }, ... )
my $value  = $chart->value('Chrome');
my $total  = $chart->total;
The slices as given, in their order (color only when the slice has one of its own, as a #rrggbb string), the value of one slice (undef for an unknown label), and the sum of all values.
Also hovered, revision and effective_background from Term::Fabulous::Widget::Chart.
EVENTS
SeriesHover (Term::Fabulous::Event::SeriesHover) when the pointer moves onto another slice or legend entry, or away. The series and the label are the slice's label (other_label for the folded slice), the value is its value, and on a slice the index is its position among the slices as drawn (after sorting and folding, from 0).
KDL PROPERTIES
use Term::Fabulous::Widget::PieChart as PieChart

PieChart "browsers" {
	title "Visitors by browser"
	sort "desc"
	other 0.03
	other_label "Rest"
	slice_labels "percent"
	legend_values "both"
	legend "bottom"
	slice "Chrome" 6420
	slice "Safari" 1830 color="#d95926"
}
The properties of "KDL PROPERTIES" in Term::Fabulous::Widget::Chart; hole, start_angle, sort, slice_labels, legend_values, center_text, marker, other, other_label, gap (#true or #false) and format as the parameters; and one slice node per slice with the label and the value as its arguments and an optional color property. The slice nodes add the slices in their order, as add_slice does; data, labels and colors are not layout properties. More slices can be added from Perl after the layout is built.
SUBCLASS INTERFACE
Term::Fabulous::Widget::DonutChart and Term::Fabulous::Widget::PolarAreaChart are subclasses of PieChart that override some of the methods below. A round chart of your own can do the same. These methods come in addition to the ones of "SUBCLASS INTERFACE" in Term::Fabulous::Widget::Chart, which PieChart already provides; $look is the hash of colors described there.
default_hole,default_slice_labels,default_legend_values-
The defaults of
hole,slice_labelsandlegend_values: 0,percentandpercent. A donut chart'sdefault_holeis 0.6; a polar area chart'sdefault_slice_labelsisnoneand itsdefault_legend_valuesisvalue. shown_slices($look)-
The slices as they are drawn: the slices with a value above 0, sorted as
sortsays, the small ones folded into one slice asotherandother_labelsay. Each is a hash withlabel,value,share(of the total, from 0 to 1) and the colors it is drawn in.legend_entriesanddraw_plotcall it. slice_geometry( $look, @slices )-
Returns one
[ $from, $to, $reach ]per slice ofshown_slices: the start and end angle in turns (0 to 1, beforestart_angleis added), and how far out the slice reaches (1 is the full radius). By default each slice takes an angle in proportion to its share and reaches the full radius; a polar area chart gives every slice the same angle and lets the value decide its reach. draw_background_grid( $surface, $x, $y, $width, $height, $circle, $look, \@slices )draw_foreground_grid( $surface, $x, $y, $width, $height, $circle, $look, \@slices )-
Called before and after the slices are drawn into the plot area at
$x,$yof the Term::Fabulous::Chart::Surface.$circleis the hash of "circle_frame" in Term::Fabulous::Chart::Radial, relative to the plot area. Both draw nothing by default; a polar area chart draws its rings behind the slices and their values in front of them.
SEE ALSO
Term::Fabulous::Widget::DonutChart, Term::Fabulous::Widget::PolarAreaChart, Term::Fabulous::Widget::Chart (title, legend, colors, hover), "CHARTS" in Term::Fabulous::Manual::Charts, "Show shares as a pie or donut (PieChart, DonutChart)" in Term::Fabulous::Cookbook::Charts, the example programs examples/widgets/pie-chart.pl and examples/widgets/pie-chart-styles.pl.