NAME
Term::Fabulous::Widget::RadarChart - Several values per series on axes around a center
SYNOPSIS
use Term::Fabulous::Widget::RadarChart;

my $chart = Term::Fabulous::Widget::RadarChart->new(
	title  => 'Laptop ratings',
	labels => [ 'Speed', 'Battery', 'Screen', 'Keyboard', 'Weight', 'Price' ],
	max    => 10,
	points => 1,
	series => [
		{ name => 'Model A', data => [ 9, 6, 8, 7, 5, 4 ] },
		{ name => 'Model B', data => [ 6, 9, 6, 8, 9, 7 ] },
		{ name => 'Average', type => 'line', line_style => 'dashed', data => [ [ Speed => 7 ], [ Price => 6 ] ] },
	],
);

$chart->set_data( 'Model A' => [ 9, 7, 8, 7, 6, 4 ] );
$chart->grid('circle');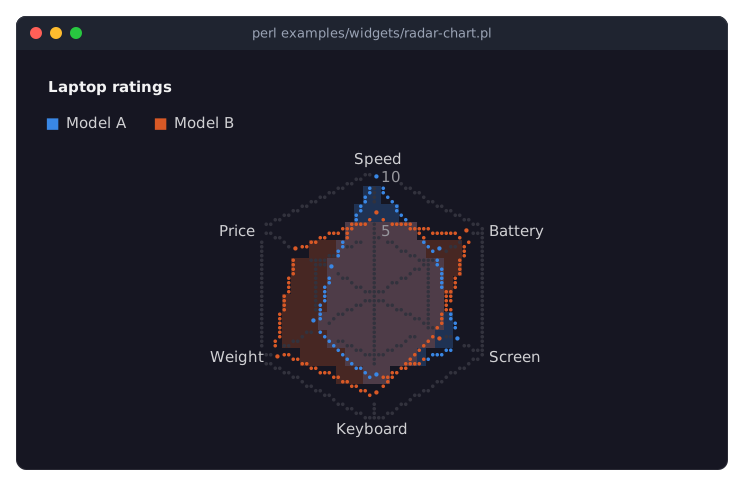
examples/widgets/radar-chart.pl draws this chart.
DESCRIPTION
A radar chart (a spider or web chart) compares profiles: each series has one value per axis, the axes radiate from a center, and the values of a series join into a polygon. One look shows where a profile is strong and where it is weak, and how two profiles differ in shape. It suits a handful of series over three to about eight axes whose values share a scale (ratings, percentages).
The axes are the labels, clockwise from 12 o'clock (start_angle turns them). Rings mark round values from the center (min, 0 by default) to the outer ring (max, a round value above the data), as a polygon through the axes or a circle, with a spoke from the center to every axis label; the values of the rings are written along the first axis. grid => 'none' leaves out the rings, the spokes and the ring values. An area series (the default type) is a translucent polygon with its outline, a line series only the outline; points marks the values. The web is drawn over the fills and under the outlines, so it stays readable.
Hover emphasizes a series and reports the axis nearest to the pointer: its label and the series' value there. The series methods are those of Term::Fabulous::Role::HasSeries; the title, legend (at the top by default), colors and hover mechanics those of Term::Fabulous::Widget::Chart.
Data
data => [ 9, 6, 8, 7, 5, 4 ]                                    # one value per label, in order
data => [ [ Speed => 9 ], [ Screen => 8 ] ]                     # by label; the others are left out
data => [ 9, undef, 8 ]                                         # a missing value
A series gives its values in the order of the labels, or as [ label, value ] pairs; a label that is not an axis dies when the data is given (add_series, set_data, add_points, ...), and the series keeps the data it had. A missing value (undef, or a label left out) is drawn at the center. Values beyond the labels are ignored. A series' transform runs on its values in axis order.
CONSTRUCTOR
new
my $chart = Term::Fabulous::Widget::RadarChart->new(%parameters);The parameters of "CONSTRUCTOR" in Term::Fabulous::Widget::Chart, and:
labels-
An array reference of at least three strings: the axes. With fewer, no plot is drawn. Default: none.
series-
An array reference of series hashes with
name,type(area, the default, orline),data,colorand the options below. See "Series keys" in Term::Fabulous::Widget::XYChart for the common keys. min,max-
Numbers: the values at the center and at the outer ring; with both given,
minmust be less thanmax. Default:undef, from the data (the center is 0 unless the data goes below). Aminnot below themaxdies when it is given, also through the accessors, and changes nothing. ticks-
A positive integer: about how many rings you want; the chart picks the round step that comes closest. Default:
undef, which spaces the rings about three rows apart, so a larger chart has more of them. grid-
polygon(the default): rings that run straight from axis to axis;circle: round rings;none: no rings, spokes or ring values. format-
How the ring values are written:
si,integer,percent, asprintfformat or a code reference; see Term::Fabulous::Chart::Format. Default:undef, as many decimals as the step between the rings needs. start_angle-
Degrees clockwise from 12 o'clock for the first axis. Default: 0.
marker,line_style,points,point,fill_opacity,transform-
Series options for every series without one of its own (a series hash may set each of them too):
marker-
The characters of the fill:
quadrant(the default),half,sextantorbraille. line_style-
The outline:
solid(the default),dashedordotted. points,point-
pointstrue marks every value;pointis the mark: a single character (a bullet,U+2022, by default), ordot(one Braille dot at the corner) orsquare(two by two Braille dots around it), drawn with the outlines as in "Points" in Term::Fabulous::Widget::XYChart. fill_opacity-
0 to 1: how much of the fill color covers the background. Default: 0.25.
transform-
Steps that prepare the values; see Term::Fabulous::Chart::Transform.
METHODS
Every parameter except series has an accessor of the same name (the series methods are listed below): without an argument it returns the value, with one it checks and sets it, and an invalid value dies and changes nothing. labels returns a copy, and dies without changing anything for labels that would leave a value of a series without its axis; transform only sets, and returns nothing.
$chart->labels( [ 'Speed', 'Battery', 'Screen', 'Keyboard', 'Weight', 'Price', 'Ports' ] );
$chart->max(undef);         # from the data again
$chart->fill_opacity(0.4);
The series are managed with the methods of Term::Fabulous::Role::HasSeries (add_series, set_series, set_data, add_points, remove_series, hide_series, ...); the chart also has hovered, revision and effective_background from Term::Fabulous::Widget::Chart.
EVENTS
SeriesHover (Term::Fabulous::Event::SeriesHover) with the series, the number of the nearest axis as the index, its label and the value there.
KDL PROPERTIES
use Term::Fabulous::Widget::RadarChart as RadarChart

RadarChart "ratings" {
	labels "Speed" "Battery" "Screen" "Keyboard" "Weight" "Price"
	max 10
	grid "circle"
	points #true
	series "Model A" { data 9 6 8 7 5 4 }
	series "Average" type="line" line_style="dashed" {
		point "Speed" 7
		point "Price" 6
	}
}
The properties of "KDL PROPERTIES" in Term::Fabulous::Widget::Chart; min, max, ticks, grid, format, start_angle, marker, line_style, points, point and fill_opacity as the parameters; labels with the axes as its arguments; and one series node per series with its name as the argument, type, color and the series options as properties, and data nodes (values in axis order) or point "label" value nodes in its block. The labels are applied before the series.
SEE ALSO
Term::Fabulous::Widget::Chart (title, legend, colors, hover), Term::Fabulous::Role::HasSeries, Term::Fabulous::Widget::PolarAreaChart, "CHARTS" in Term::Fabulous::Manual::Charts, "Compare profiles on radar and polar area charts (RadarChart, PolarAreaChart)" in Term::Fabulous::Cookbook::Charts, the example program examples/widgets/radar-chart.pl.